
Alright guysss… welcom back to our channel…
source/data_scatterplot.js
export default {
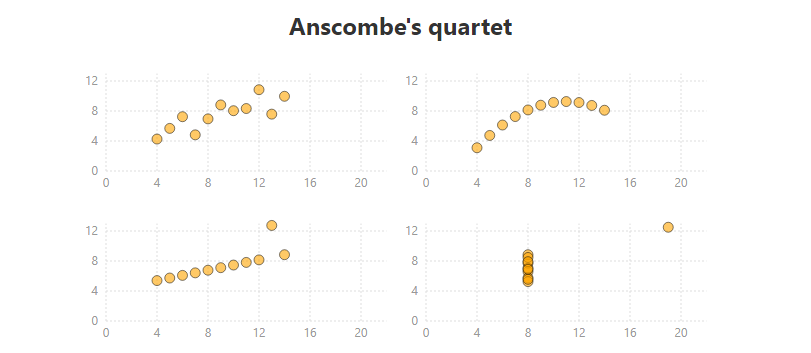
a: [
{ x: 10, y: 8.04 },
{ x: 8, y: 6.95 },
{ x: 13, y: 7.58 },
{ x: 9, y: 8.81 },
{ x: 11, y: 8.33 },
{ x: 14, y: 9.96 },
{ x: 6, y: 7.24 },
{ x: 4, y: 4.26 },
{ x: 12, y: 10.84 },
{ x: 7, y: 4.82 },
{ x: 5, y: 5.68 }
],
b: [
{ x: 10, y: 9.14 },
{ x: 8, y: 8.14 },
{ x: 13, y: 8.74 },
{ x: 9, y: 8.77 },
{ x: 11, y: 9.26 },
{ x: 14, y: 8.1 },
{ x: 6, y: 6.13 },
{ x: 4, y: 3.1 },
{ x: 12, y: 9.13 },
{ x: 7, y: 7.26 },
{ x: 5, y: 4.74 }
],
c: [
{ x: 10, y: 7.46 },
{ x: 8, y: 6.77 },
{ x: 13, y: 12.74 },
{ x: 9, y: 7.11 },
{ x: 11, y: 7.81 },
{ x: 14, y: 8.84 },
{ x: 6, y: 6.08 },
{ x: 4, y: 5.39 },
{ x: 12, y: 8.15 },
{ x: 7, y: 6.42 },
{ x: 5, y: 5.73 }
],
d: [
{ x: 8, y: 6.58 },
{ x: 8, y: 5.76 },
{ x: 8, y: 7.71 },
{ x: 8, y: 8.84 },
{ x: 8, y: 8.47 },
{ x: 8, y: 7.04 },
{ x: 8, y: 5.25 },
{ x: 19, y: 12.5 },
{ x: 8, y: 5.56 },
{ x: 8, y: 7.91 },
{ x: 8, y: 6.89 }
]
};dan buat ScatterplotComp.svelte
<script>
	import { onMount } from 'svelte';
	import { scaleLinear } from 'd3-scale';

	export let points;

	let svg;
	let width = 500;
	let height = 200;

	const padding = { top: 20, right: 40, bottom: 40, left: 25 };

	$: xScale = scaleLinear()
		.domain([0, 20])
		.range([padding.left, width - padding.right]);

	$: yScale = scaleLinear()
		.domain([0, 12])
		.range([height - padding.bottom, padding.top]);

	$: xTicks = width > 180 ?
		[0, 4, 8, 12, 16, 20] :
		[0, 10, 20];

	$: yTicks = height > 180 ?
		[0, 2, 4, 6, 8, 10, 12] :
		[0, 4, 8, 12];

	onMount(resize);

	function resize() {
		({ width, height } = svg.getBoundingClientRect());
	}
</script>

<svelte:window on:resize='{resize}'/>

<svg bind:this={svg}>
	<!-- y axis -->
	<g class='axis y-axis'>
		{#each yTicks as tick}
			<g class='tick tick-{tick}' transform='translate(0, {yScale(tick)})'>
				<line x1='{padding.left}' x2='{xScale(22)}'/>
				<text x='{padding.left - 8}' y='+4'>{tick}</text>
			</g>
		{/each}
	</g>

	<!-- x axis -->
	<g class='axis x-axis'>
		{#each xTicks as tick}
			<g class='tick' transform='translate({xScale(tick)},0)'>
				<line y1='{yScale(0)}' y2='{yScale(13)}'/>
				<text y='{height - padding.bottom + 16}'>{tick}</text>
			</g>
		{/each}
	</g>

	<!-- data -->
	{#each points as point}
		<circle cx='{xScale(point.x)}' cy='{yScale(point.y)}' r='5'/>
	{/each}
</svg>

<style>
	svg {
		width: 50%;
		height: 50%;
		float: left;
	}

	circle {
		fill: orange;
		fill-opacity: 0.6;
		stroke: rgba(0,0,0,0.5);
	}

	.tick line {
		stroke: #ddd;
		stroke-dasharray: 2;
	}

	text {
		font-size: 12px;
		fill: #999;
	}

	.x-axis text {
		text-anchor: middle;
	}

	.y-axis text {
		text-anchor: end;
	}
</style>
kemudian kita buat Scatterplot.svelte
<script>
	import Scatterplot from './ScatterplotComp/ScatterplotComp.svelte';
	import data from './sources/data_scatterplot';
</script>

<div class="chart">
	<h2>Anscombe's quartet</h2>

	<Scatterplot points={data.a}/>
	<Scatterplot points={data.b}/>
	<Scatterplot points={data.c}/>
	<Scatterplot points={data.d}/>
</div>

<style>
	.chart {
		width: 100%;
		max-width: 640px;
		height: calc(100% - 4em);
		min-height: 280px;
		max-height: 480px;
		margin: 0 auto;
	}
</style>
dan import ke App.svelte
	<Clock />
	<BarChart />
	<AreaChart />
	<Scatterplot />

</main>
dan hasilnya…
Okay cukup sekian ya… berikut link github ada disini…. cyaaaa